UW-Madison Masters Research
Thompson Lab
Thermal energy transport and conversion. Calorimetry. Nanofabrication.
Projects
Temperature Controlled Microscope Stage
Non-Disclosure Agreement: I will only disclose non-proprietary information regarding my work at UW-Madison.
My two year long master’s thesis project was the development of a temperature controlled microscope heating stage for the Thompson lab at UW-Madison. The goal of the project was to develop a system that could heat up nanofabricated chips uniformly, provide connection points to silicon chips via wire bonding, maintain a steady temperature during operation, and prevent vertical sample drift due to thermal expansion. The system was designed to operate within a vacuum chamber and be quickly removable. Advanced engineering materials such as Super Invar, SCHOTT AG ZERODUR glass, and PEEK were used to achieve near zero thermal expansion in the fixture. Comsol and Solidworks were used to simulate the thermal effects of the PID controlled radial ceramic heater.

Temperature Controlled Microscope Stage
I was responsible for all stages of the heating stage development including the following: research, proof of concept, simulation, manufacturing, and testing. UW-Madison’s machine shop and Makerspace were used to prototype the components allowing me to quickly iterate. External suppliers were contracted for parts made from Super Invar and ZERODUR glass as I did not have the equipment to machine them in house.
Upon completion, the heating system has been used by the lab to develop advanced nanoscale calorimeters, measure the thermoreflectance coefficients of materials, and develop thermoreflectance measurement systems with improved temperature sensitivity for silicon thin films.
Processes Utilized
CNC Machining
Precision Grinding & Polishing
Waterjet & Laser Cutter
3D Printing (FDM, SLS, SLA)
Wire bonding
PCBA Assembly
Top Skills Utilized
Rapid Prototyping
Thermal Simulations
CNC Machining
Root Cause & Failure Analysis
Design for Vaccum
Technical Writing
Sections Below
Concept Development
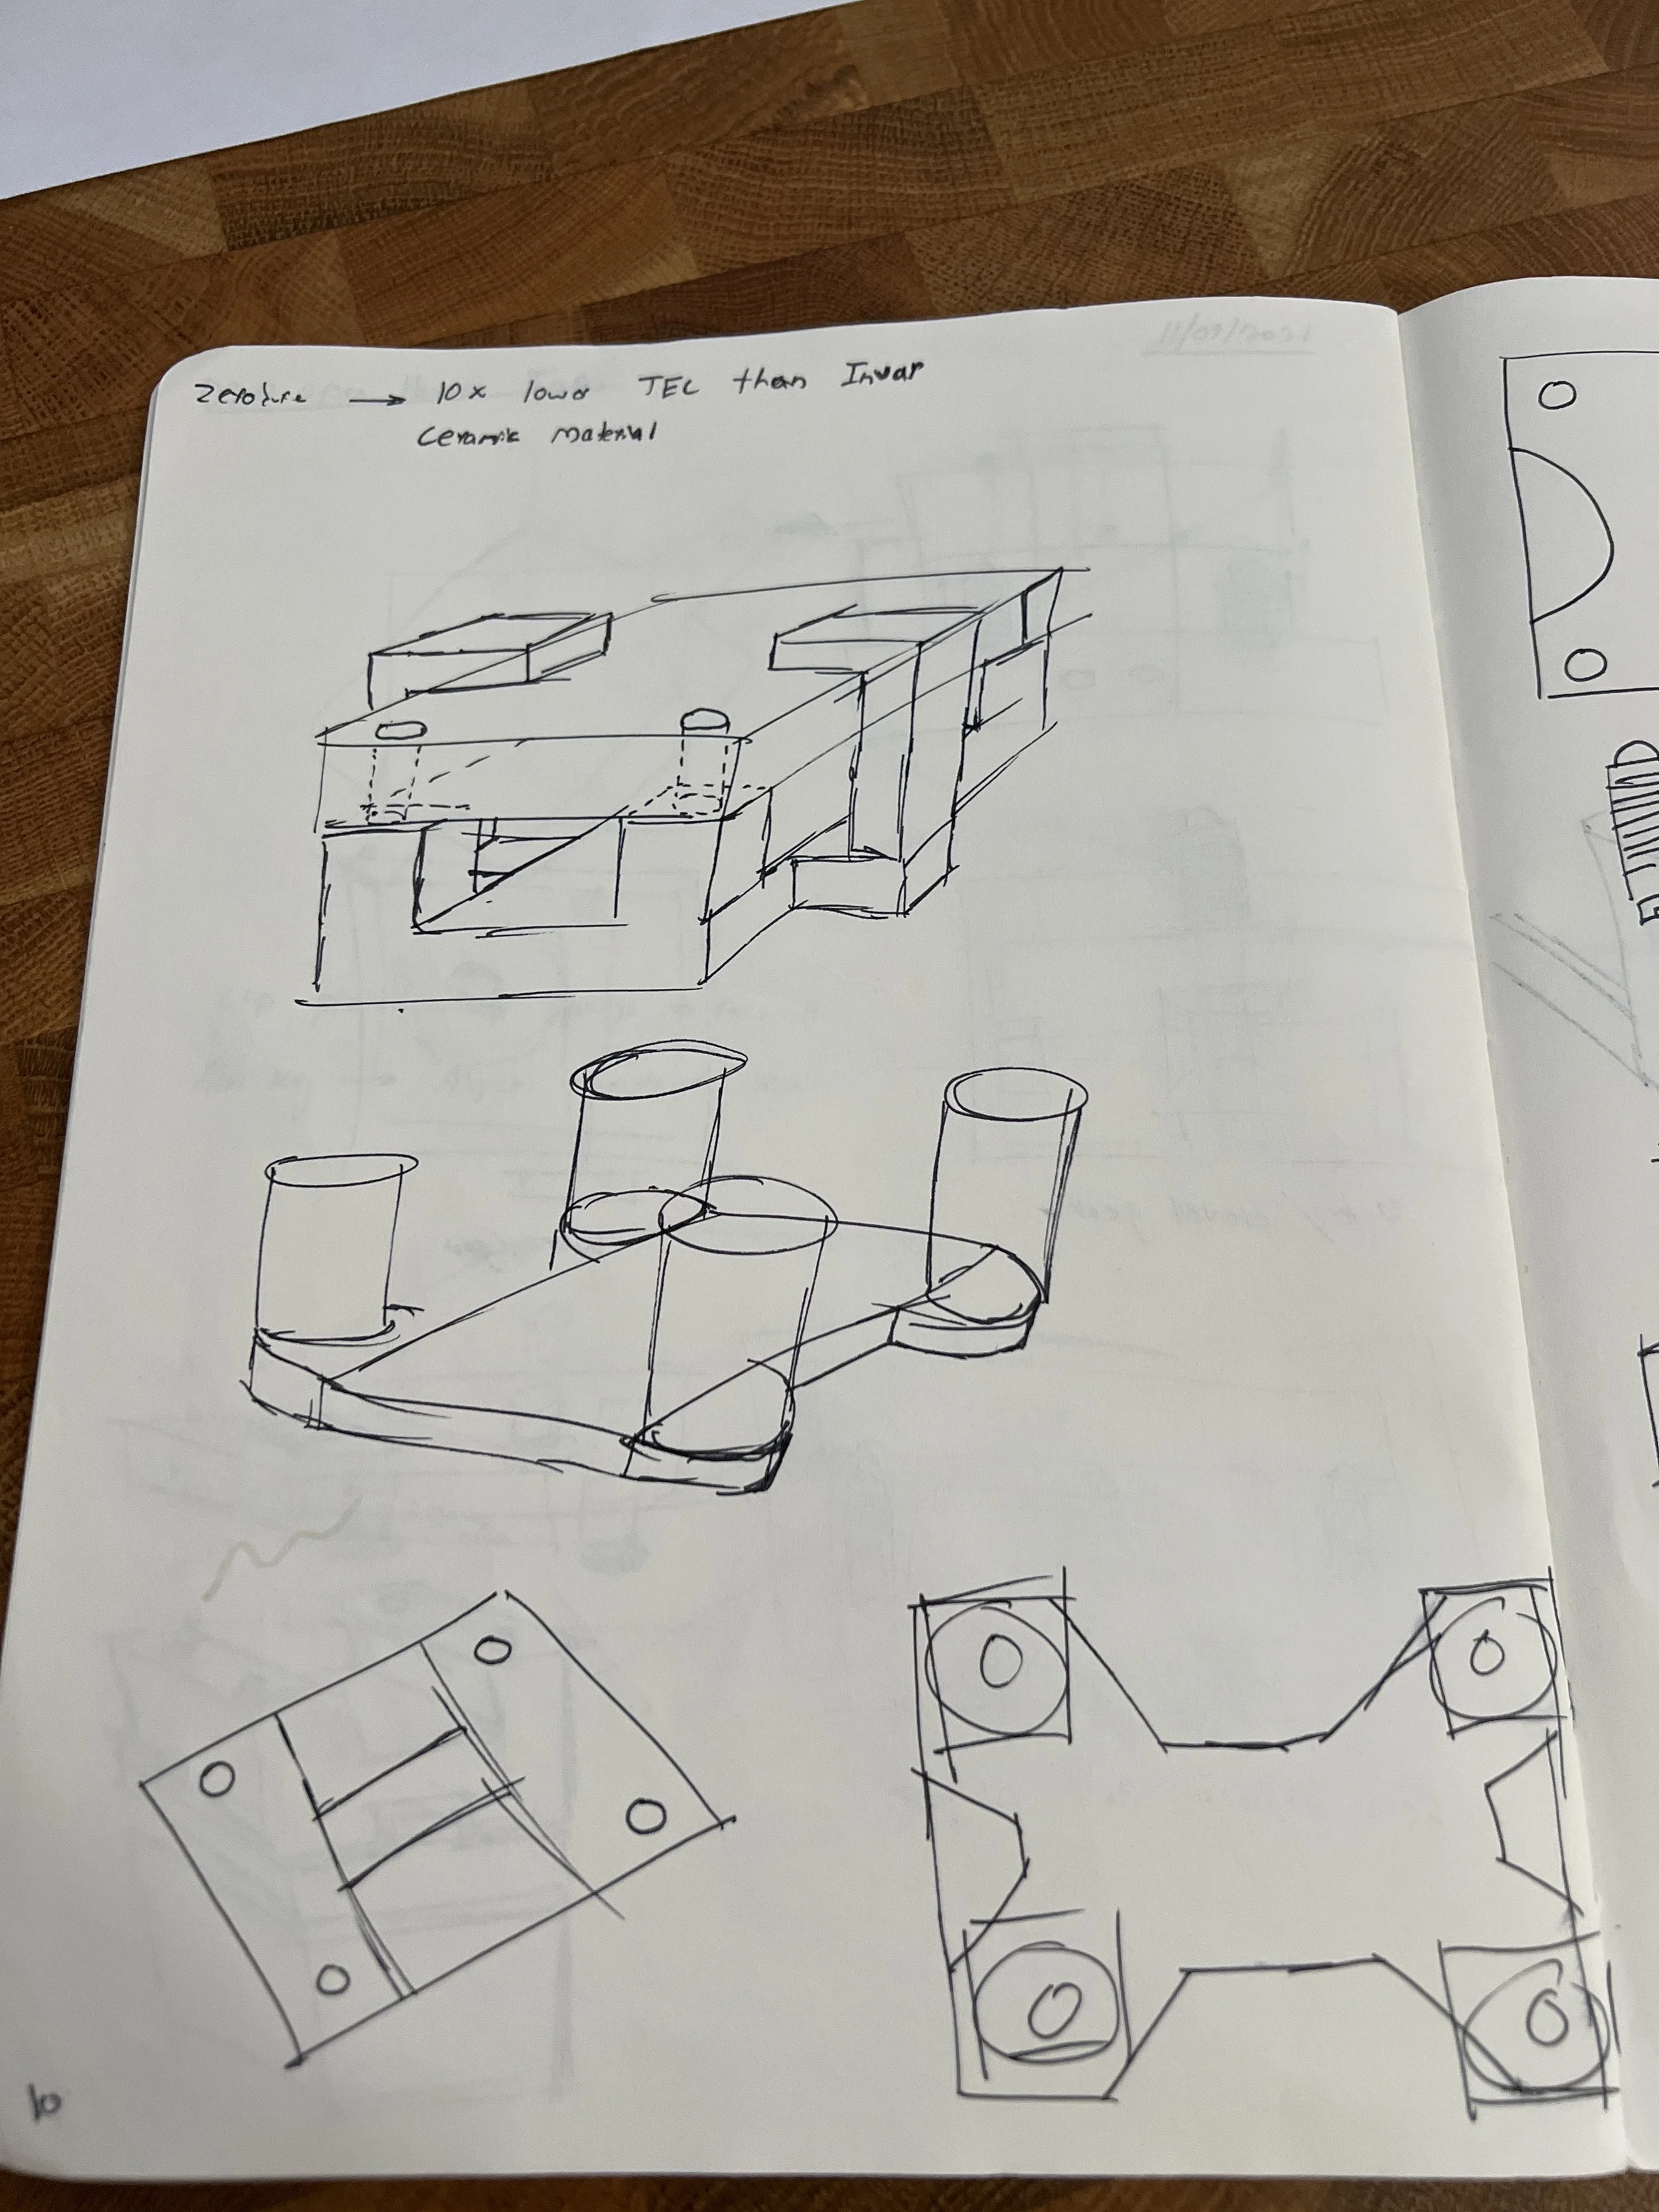
It all begins with an idea. The project began with research and concept sketching from which a starting point was developed. Prototypes were built and tested. The goal was to develop a minimum viable product to start testing with.


CAD & Simulation
The concepts were mocked up in CAD, and COMSOL was used for thermal simulations on the system. Simulations were used to determine the size of the Zerodur posts and the Invar Sample Carrier.
Initial Designs


Final Design


Simulations

Isometric view (a) without mesh, and (b) with mesh. (c) Cross-sectional view showing spherical spring plunger models, heater, and sample with fine mesh settings.
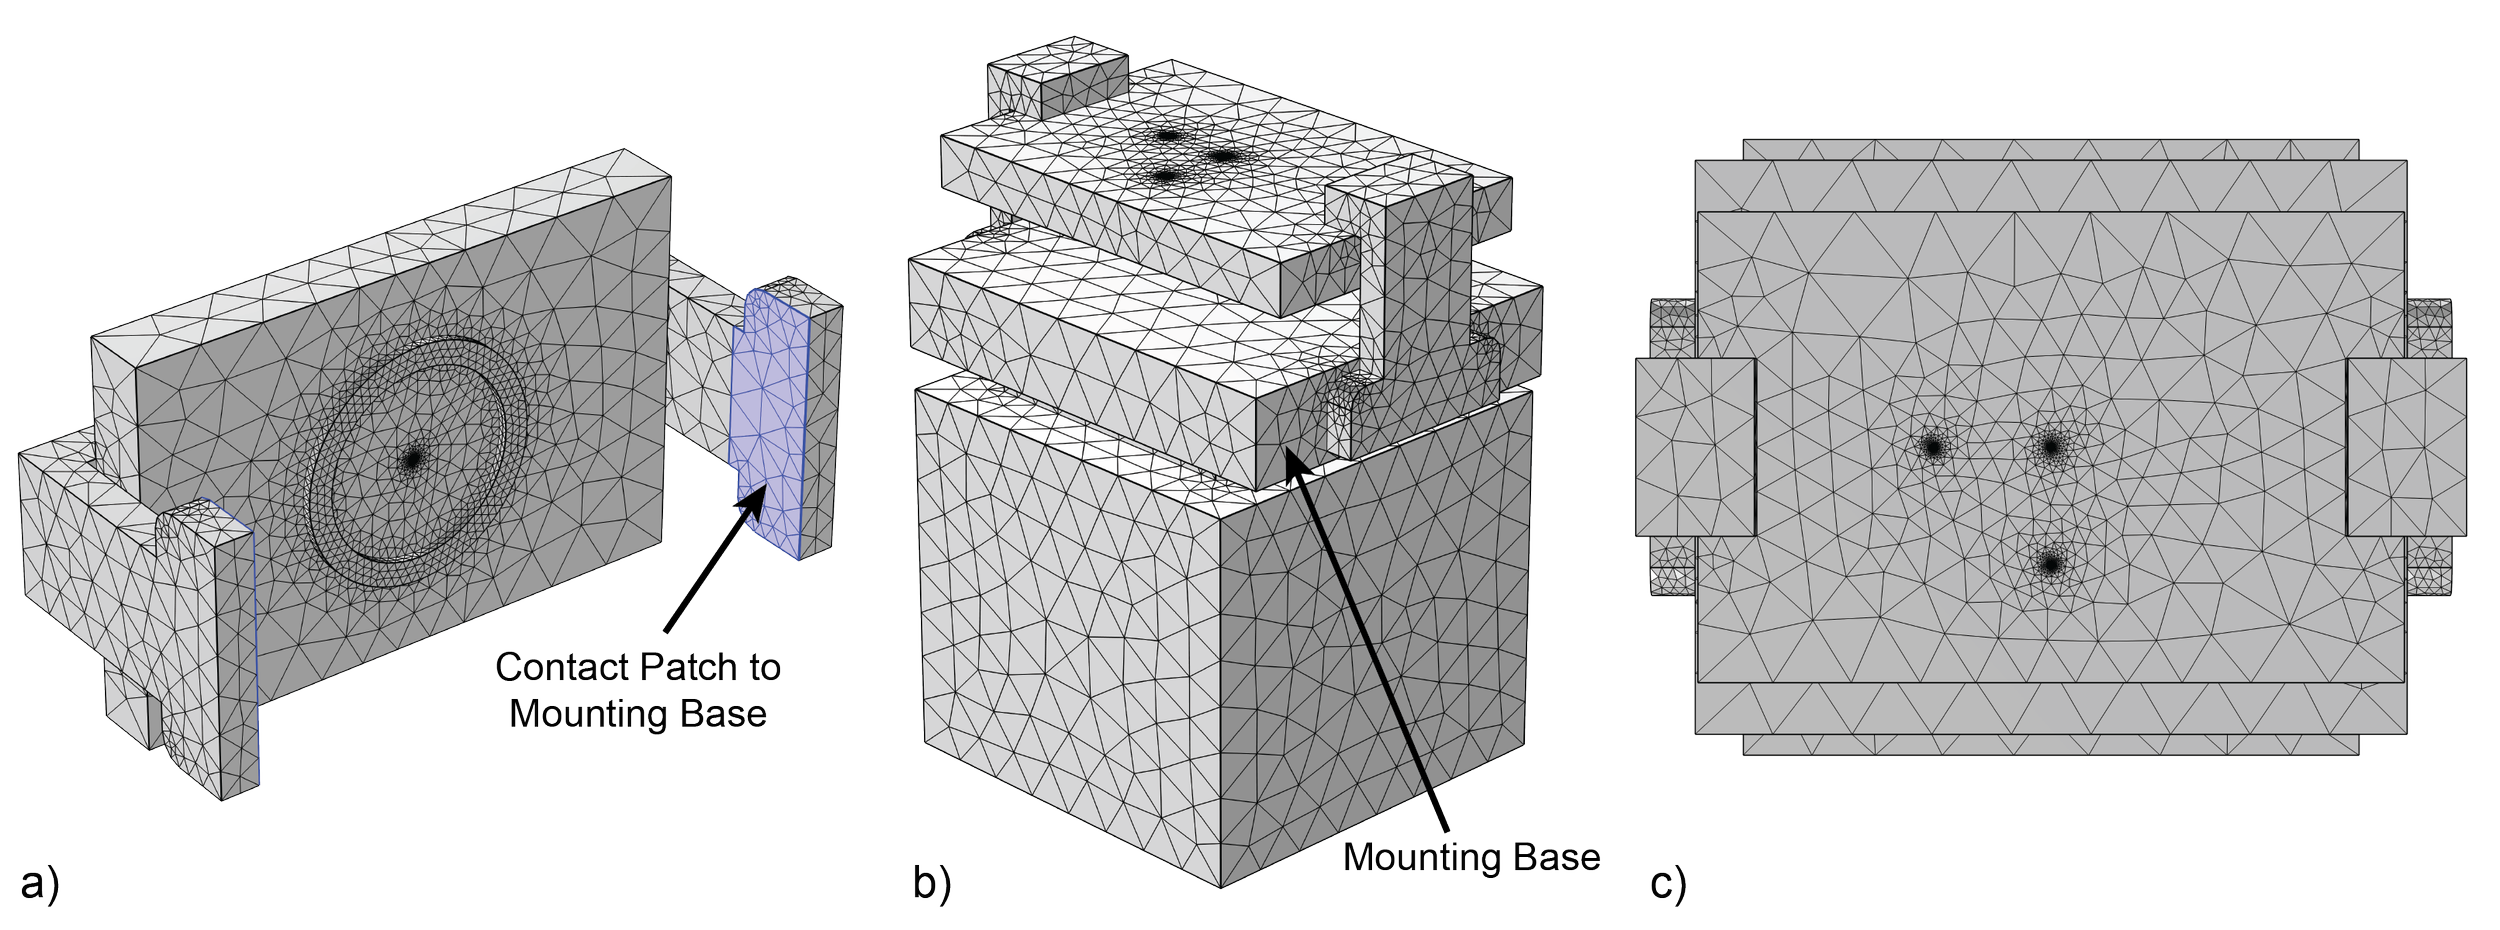
(a) Bottom view of sample carrier plate with a fine mesh applied to the ceramic heater and the temperature probe. (b) Isometric view of the simplified heating stage geometry with mesh applied. (c) Top view of the sample carrier plate with fine mesh applied to the temperature probes.

(a) Image of heating stage temperature distribution after a 10 Watt heating input was applied. (b) Zoomed in image of heating stage spring plunger temperature profile.

Steady-state temperature map of the heating stage. (a) Isometric view, and (b) top view with an invar plate of dimensions 40 mm x 60 mm x 7 mm and ZERODUR posts with a 15 mm width and 6 mm tab length. The maximum temperature achieved at the center of the sample carrier is 152.48 C.

(a) Plot of the impact of varying the thickness of the invar sample carrier versus thermal expansion at the center of the device. The ZERODUR post dimensions were held constant at a width of 15 mm and a post tab length of 6 mm. (b) Rendering of the sample carrier geometry.

Plot of the impact of varying the width of the ZERODUR posts on the thermal expansion at the center of the sample carrier. 10 mm, 15 mm, and 20 mm post widths were simulated. The post tab length was held constant at 6 mm and the invar sample carrier thickness was 10 mm. (b) Rendering of the post geometry.
Design Parameters from Simulation Results
40 mm x 60 mm x 7 mm invar plate
15 mm width x 6mm long ZERODUR post
Maximum temperature of 152.48 deg C (limited to 90 deg C by heater maximum)
Temperature gradient < 1% (1.44 deg C) across sample mounting area
Simulated thermal expansion of 4.17 nm/deg C
Time Constant: 29.1 minutes
MANUFACTURING & PROTOTYPING
One part at a time.
Prototypes
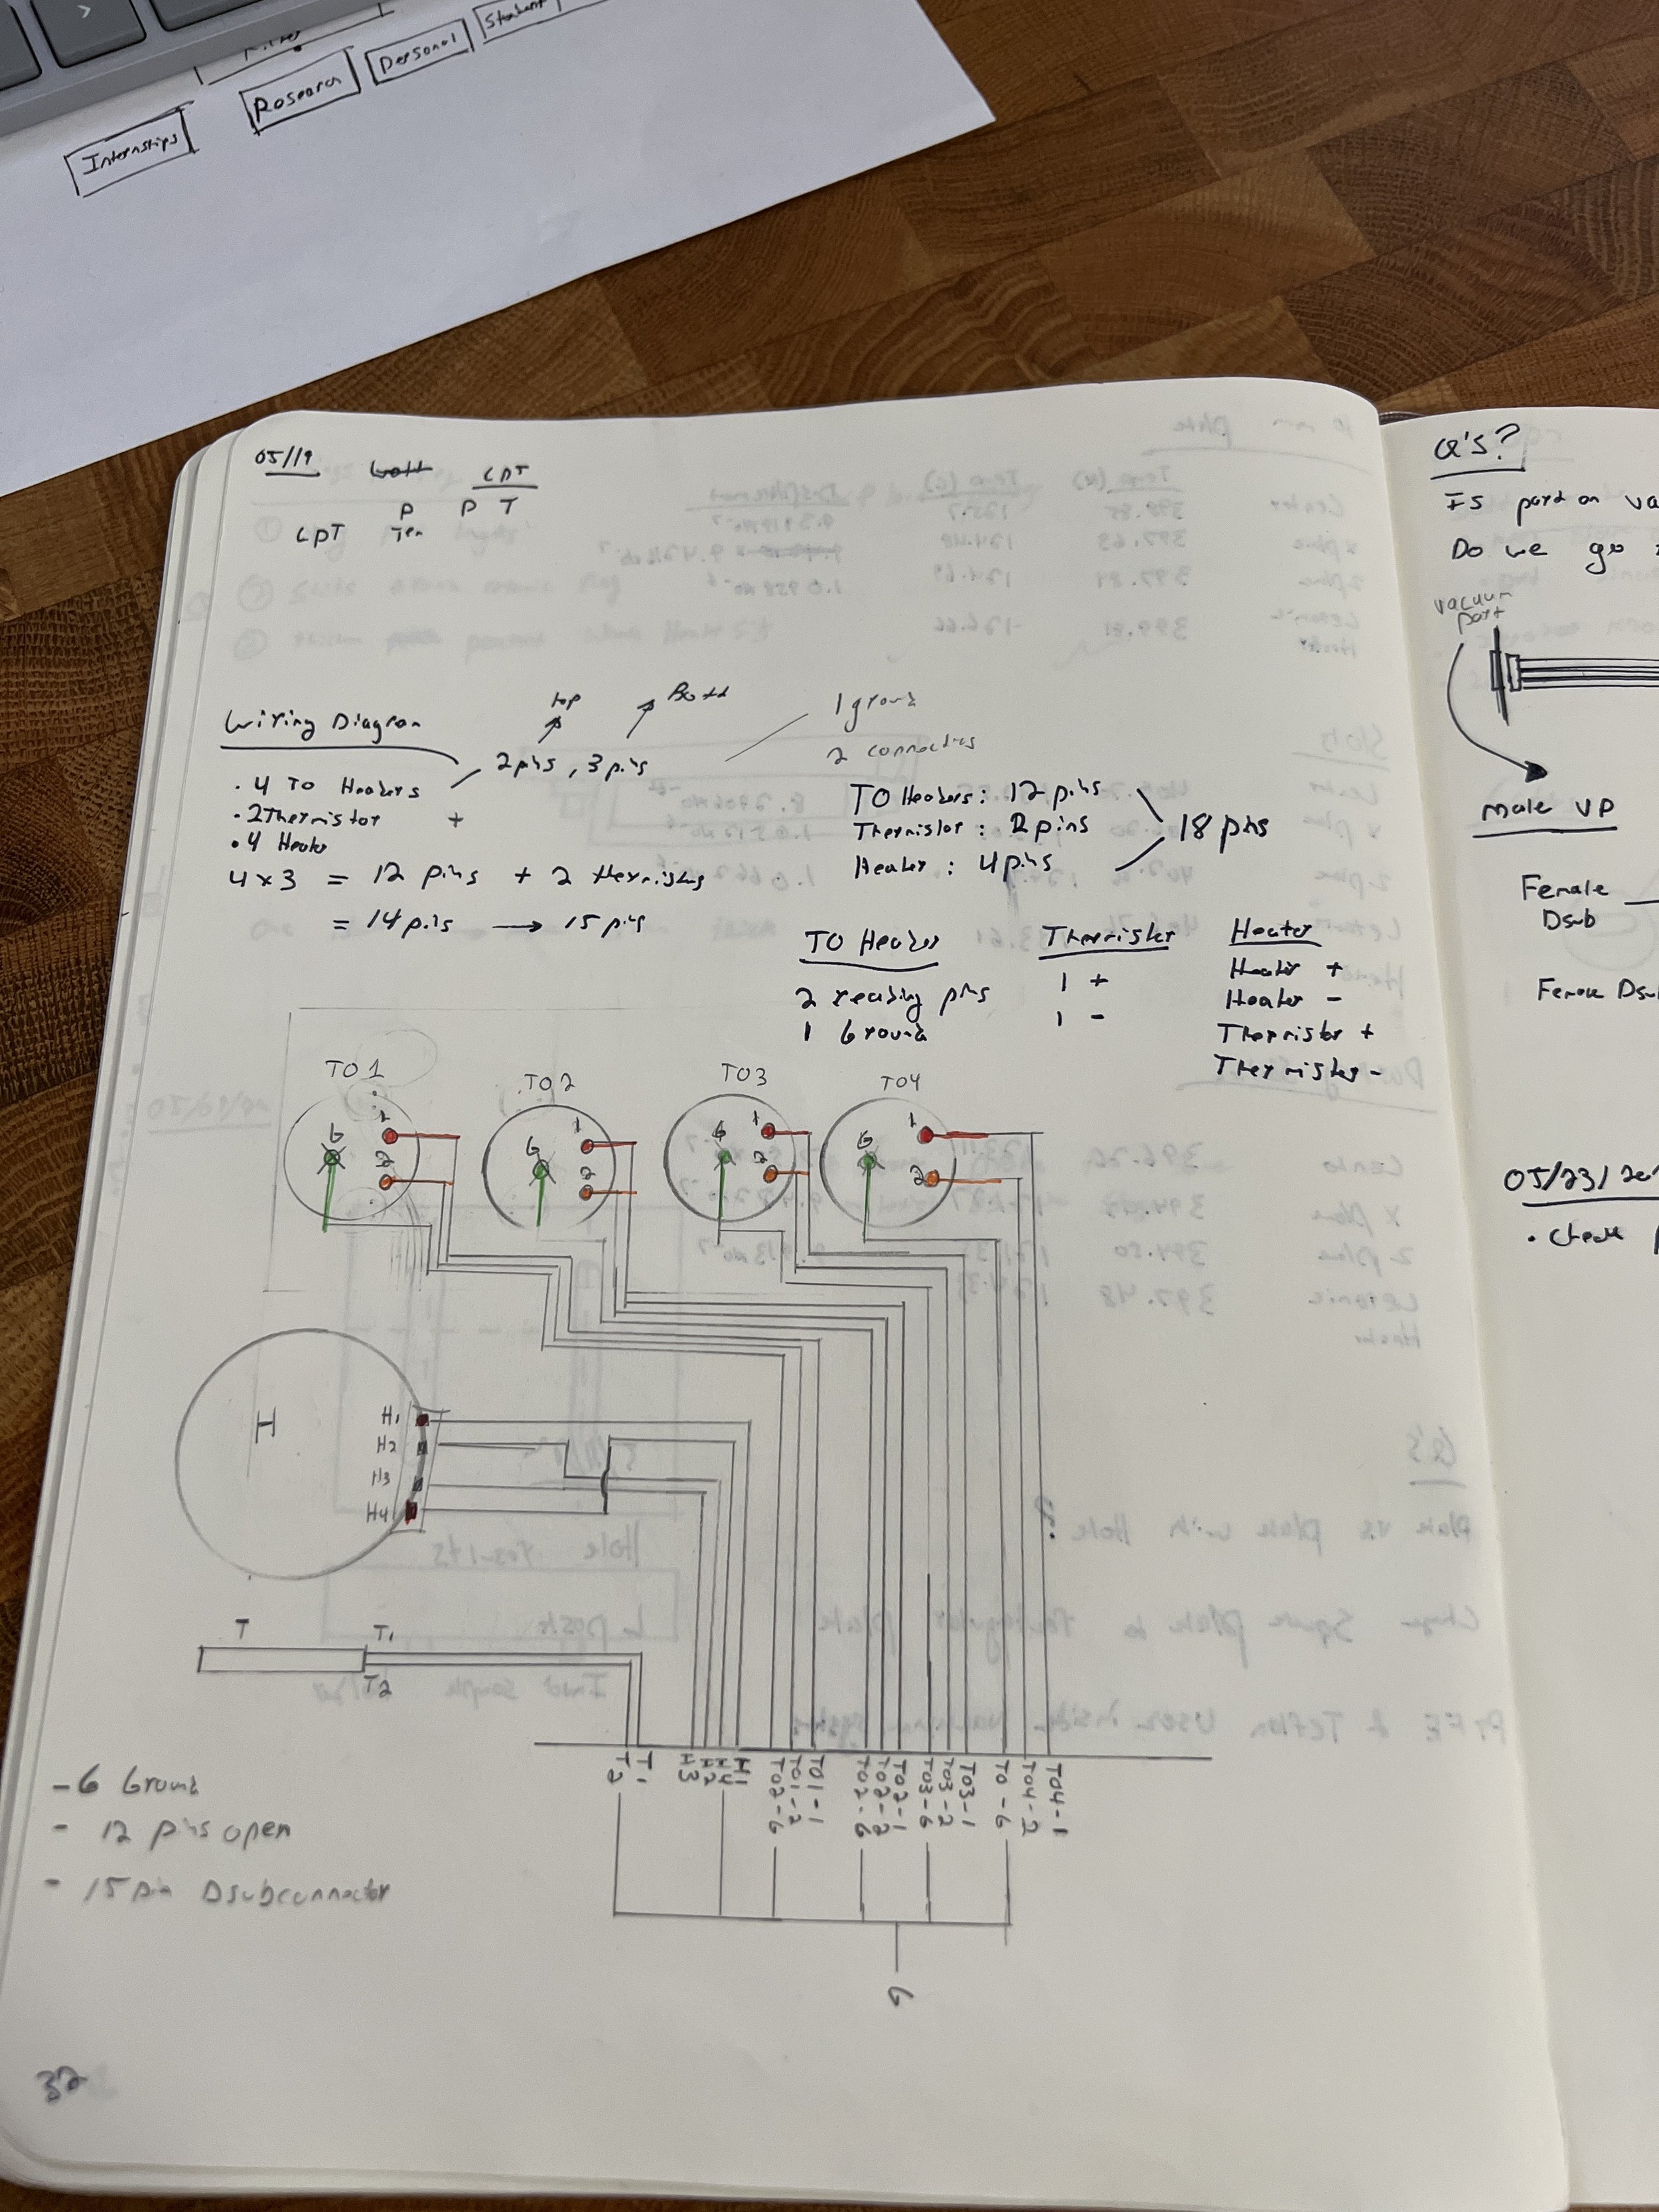
The components for the first prototype were machined at UW-Madison’s machine shop excluding the invar sample carrier and the ZERODUR posts (outsourced). The gold transistor outline headers were installed using high temperature low outgassing vacuum compatible epoxy. Kapton coated wires were used to connect the TO headers to fluorinated ethylene-propylene (FEP) vacuum compatible ribbon cable. The base for the stage was machined from 6061 aluminum due to its low outgassing rate. The spring plungers and remaining components were assembled.


V2


Early testing showed that the aluminum spring plungers increased the aluminum base temperature beyond acceptable limits. A new polyetheretherketone (PEEK) component was designed to isolate the spring plungers from the aluminum base. PEEK was chosen due to its low thermal conductivity and its machinability.
A laguna 8 ft x 4 ft CNC router with an auto tool changer was programmed to machine the PEEK part because the machine shop CNC mills were unavailable. Compressed air was used to cool the plastic.

TESTING
Does it actually work…
Testing Conducted
Electrical Continuity
Thermal Response
Thermal expansion measurements with Atomic Force Microscopy (AFM)
Thermal expansion measurements with surface profiler
Operation under Vacuum
Equipment Used
ICON Atomic Force Microscope
ZYGO Newview 9000 optical surface profiler
ThorLabs TC300 Temperature Controller
Results
Thermal Response

Temperature Stability of +/- 0.01 degrees C
Temperature Offset of 0.472 degrees C
Surface mounted thermistors were mounted on the top surface of the sample carrier with crystalbond adhesive and then wire bonded to the TO headers. A Thorlabs TC300 temperature controller was used to record the thermistor temperature and the built in sensor in the ceramic ring heater as the temperature was stepped up and down. MATLAB was used to plot the data.

(a) Plot of the step response of the heating stage from 25 deg C to 35 deg C and back to 25 deg C for the surface mounted thermistor, the heater thermistor, and the set target temperature. (b) A zoomed in view of the 30 deg C to 31 deg C temperature step. (c) The surface thermistor reads a temperature stability of ±0.01 deg C.
Thermal Expansion - AFM
Average Sample Carrier Thermal Expansion of 82.12 nanometers/degree C
Thermal equilibrium Time Constant: 6.84 minutes
Thermal equilibrium: 10.84 minutes
The ICON AFM at UW-Madison’s Material Science Department was used in tapping mode to scan the surface of a gold plated silicon wafer mounted to the top surface of the sample carrier. Scanning over a period of 20 minutes (5 minutes steady state + 15 minutes of temperature increase) and a 1 micron length allowed the AFM to pick up the thermal expansion.


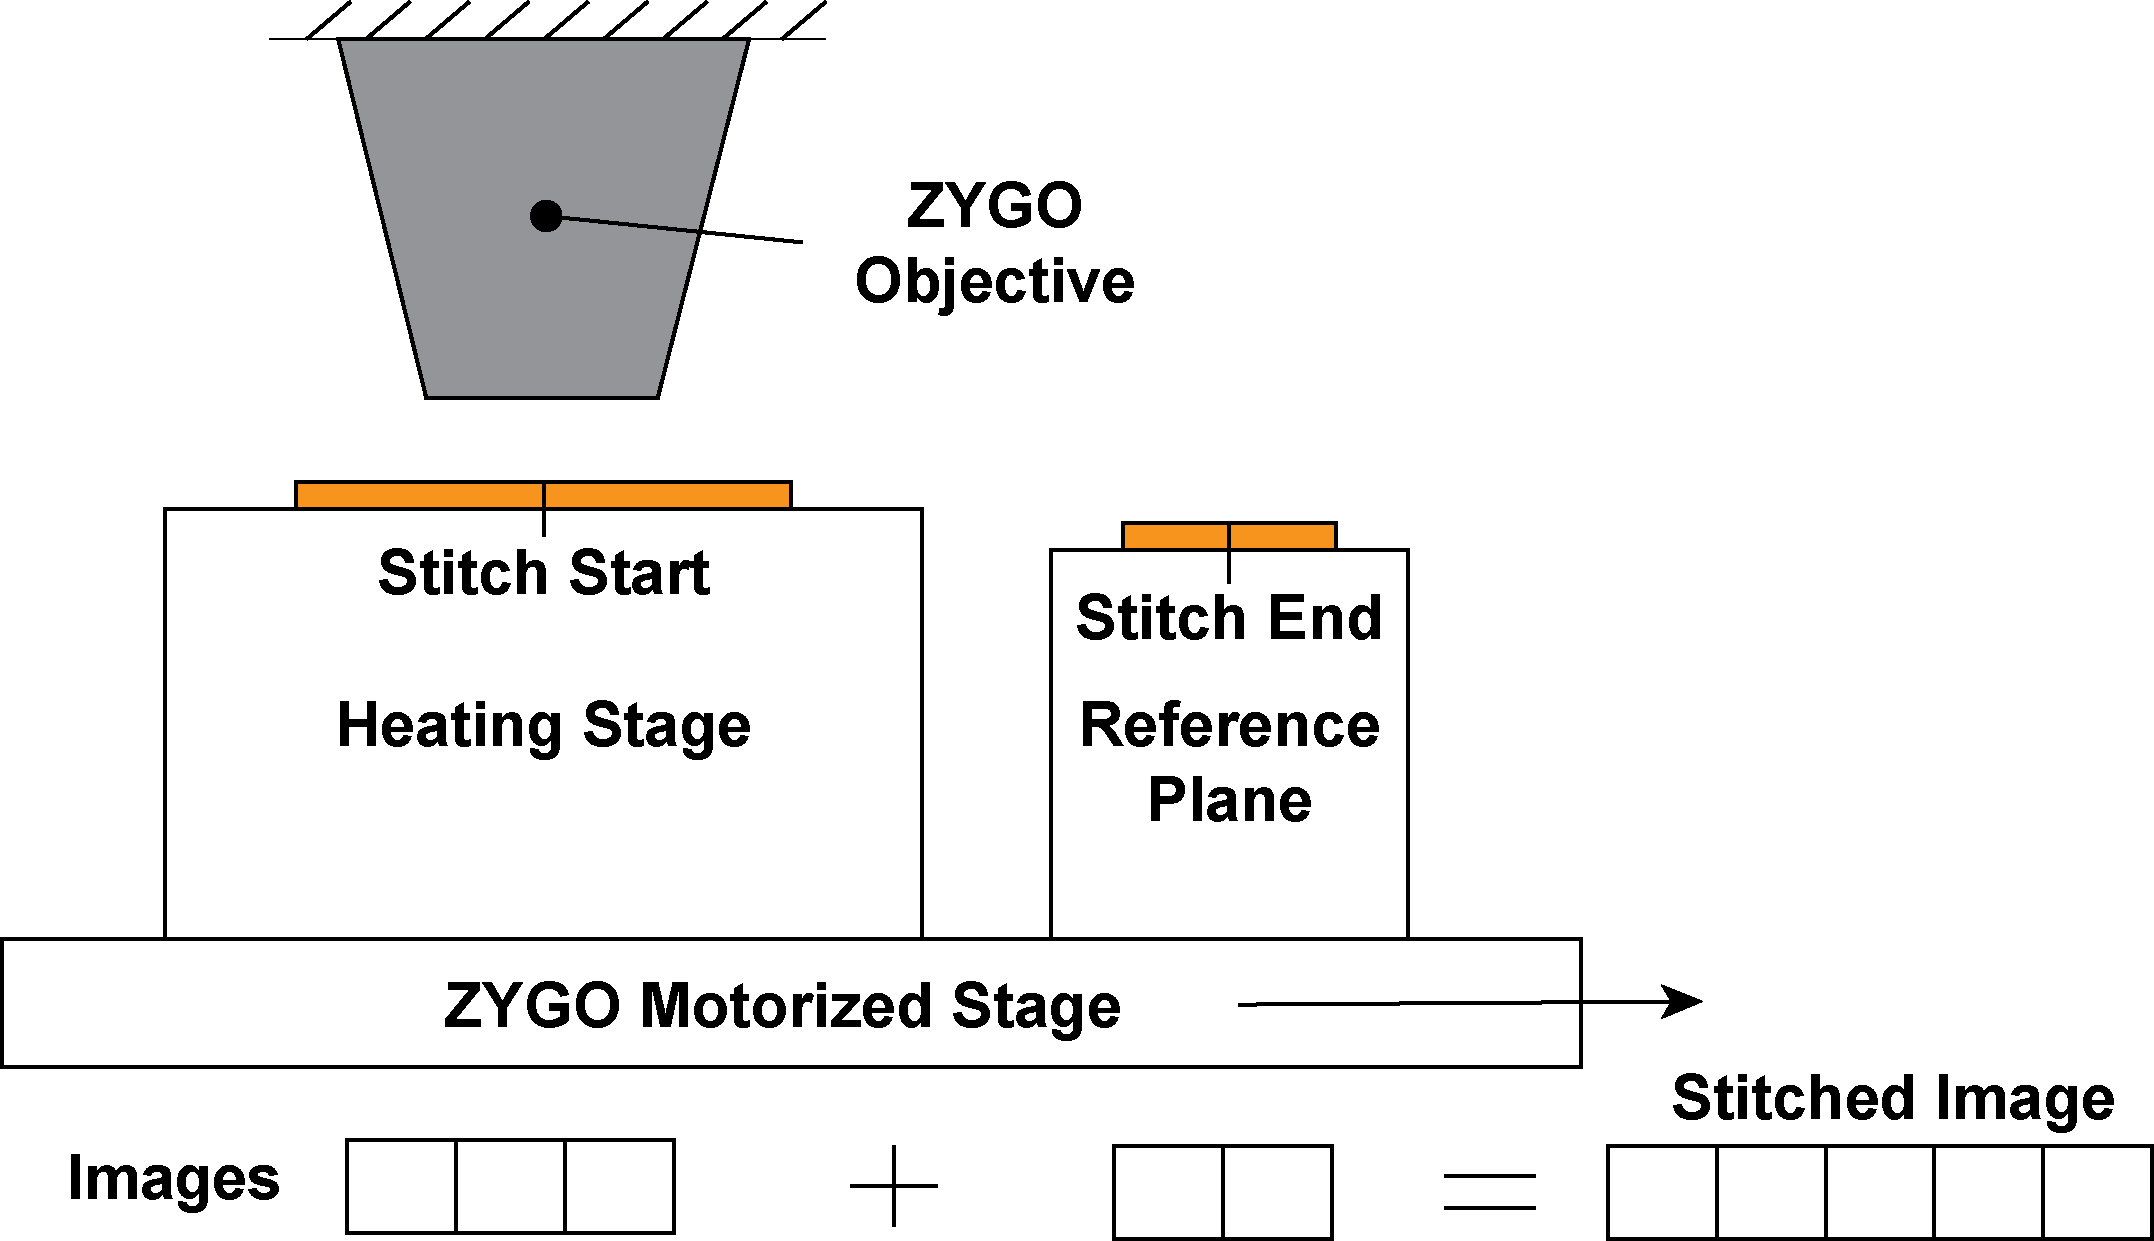
Thermal Expansion - Optical Profiler
Average Sample Carrier Thermal Expansion of 68 nm/degree C - Noisier data set
The second method used to measure thermal expansion was with a ZYGO optical profiler. This measurement was conducted by stitching 3D surface scans together and comparing them to a fixed thermally isolated reference surface. A waterjet was used to cut an adapter plate for the heating stage and a mill was used to machine the reference block from 6061 to the height of the sample carrier. I worked with application engineers at ZYGO to create the custom program to automatically scan the surfaces and stitch the images together at each temperature step.